


IFF Reports First Quarter 2018 Results
Achieved strong growth across all financial metrics;
Targeting upper end of 2018 sales and operating profit guidance range
This press release features multimedia. View the full release here: https://www.businesswire.com/news/home/20180506005087/en/
(Photo: Business Wire)
First Quarter 2018 Consolidated Summary: Change vs. Prior Year
| Reported (GAAP) | Adjusted (Non-GAAP)¹ | Currency Neutral (Non-GAAP)¹ | |||||||||||||||||||||||||
| Sales |
Operating |
EPS | Sales |
Operating |
EPS | Sales |
Operating |
EPS | |||||||||||||||||||
| Consolidated | 12% | 34% | 12% | 12% | 16% | 11% | 7% | 12% | 12% | ||||||||||||||||||
¹ Schedules at the end of this release contain reconciliations of reported GAAP to non-GAAP metrics.
Management Commentary
“We have started the year very well, with robust growth across all of
our key financial metrics,” said IFF Chairman and CEO
“Cost and productivity initiatives continued to play an integral role in our ability to invest in the business while delivering robust profit growth. Through the combination of these initiatives, as well as our strong sales growth, we delivered double-digit operating profit and EPS growth.”
Mr. Fibig added, “We are off to a strong start to the year and that gives us added confidence in achieving our financial objectives for 2018. And while it’s still early in the year, we believe we will be closer to the upper end of our previously communicated sales and operating profit guidance range.”
First Quarter 2018 Consolidated Financial Highlights
-
Reported net sales for the first quarter totaled
$931 million , an increase of 12% from$828 million in 2017. Excluding the impact of foreign exchange, currency neutral sales increased 7% over the prior year. -
Reported operating profit for the first quarter was
$175 million versus$130 million reported in 2017, an increase of 34%. Excluding the impact of foreign exchange and those items that affect comparability, currency neutral adjusted operating profit grew 12%, principally driven by volume growth, the benefits associated with cost and productivity initiatives and favorable sales mix. -
Reported earnings per share (EPS) for the first quarter was
$1.63 per diluted share versus$1.45 per diluted share reported in 2017. Excluding the impact of foreign exchange and those items that affect comparability, currency neutral adjusted EPS improved 12%.
First Quarter 2018 Segment Summary: Growth vs. Prior Year
| Reported (GAAP) | Currency Neutral (Non-GAAP) | |||||||||||
| Sales |
Segment |
Sales |
Segment |
|||||||||
| Flavors | 11% | 18% | 6% | 15% | ||||||||
| Fragrances | 14% | 20% | 8% | 12% | ||||||||
Flavors Business Unit
-
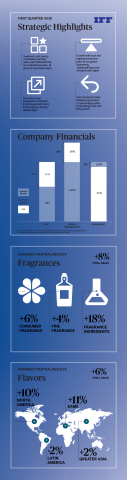
On a reported basis, sales increased 11%, or
$42.9 million , to$449.0 million . Currency neutral sales grew 6% driven by growth in all categories and nearly all regions. -
EAME increased 24% on a reported basis and 11% on a currency neutral
basis, led by strong double-digit growth in
Africa and theMiddle East as well as mid-single digit growth inEurope . Growth was achieved across all categories, led by strong performances in Dairy, Savory, and Beverage. -
North America improved 10% driven by double-digit growth at Tastepoint℠ and strong new wins in Beverage and Dairy. -
Latin America decreased 2% on a reported and currency neutral basis. Mid-single digit growth in South Cone was more than offset by softness inMexico andColombia – both of which grew strong double-digits in the year-ago period. On a category basis, strong double-digit growth was achieved in Savory as well as low-single digit growth in Dairy. -
Greater Asia increased 6% on a reported basis and 2% on a currency neutral basis, as double-digit growth inIndia andChina was muted by softness inIndonesia and the ASEAN region. On a category basis, growth was strongest in Sweet, Savory and Dairy. - Flavors segment profit increased 18% on a reported basis and 15% on a currency neutral basis, driven primarily by volume growth, the benefits from productivity initiatives and favorable sales mix.
Fragrances Business Unit
-
On a reported basis, sales increased 14%, or
$59.8 million , to$481.9 million . Currency neutral sales improved 8%, with broad-based growth from all categories and regions. -
Fine Fragrances increased 12% on a reported basis and 4% on a currency
neutral basis led by strong double-digit growth in LATAM and
North America . - Consumer Fragrances grew 11% on a reported basis and 6% on a currency neutral basis with growth achieved in all categories. Performance was led by high-single digit increases in Home Care, Toiletries, and Hair Care. On a geographic basis, growth was broad-based, with all regions contributing positively to the results.
- Fragrance Ingredients grew 26% on a reported basis and 18% on a currency neutral basis, with growth in all regions as well as very strong double-digit growth in Cosmetic Active Ingredients.
- Fragrances segment profit increased 20% on a reported basis and 12% on a currency neutral basis driven primarily by volume growth and the benefits from cost and productivity initiatives.
The Company’s full year 2018 guidance:
| Currency Neutral | FX Impact1 | Adjusted2 | |||||||
| Sales | 3.0% - 5.0% | ~3.0% | 6.0% - 8.0% | ||||||
| Operating Profit | 5.0% - 7.0% | ~1.5% | 6.5% - 8.5% | ||||||
| EPS | 4.0% - 6.0% | ~1.5% | 5.5% - 7.5% | ||||||
1 See Use of Non-GAAP Financial Measures
2 Excludes items impacting comparability
A copy of the Company’s Quarterly Report on Form 10-Q will be available
on its website at www.iff.com
or at www.sec.gov
by
IFF to Combine with
In a separate press release issued today, IFF announced its intention to
combine with
Audio Webcast
A live webcast to discuss the Company’s first quarter 2018 financial
results will be held on
Cautionary Statement Under The Private Securities Litigation Reform Act of 1995
This press release includes “forward-looking statements” under the
Federal Private Securities Litigation Reform Act of 1995, including
statements regarding our outlook in our full year 2018 guidance,
including our focus to drive differentiation, balance our customer base,
maximize our portfolio and our ability to deliver growth across all of
our key financial metrics and the impact of our actions on value
creation for our shareholders. These forward-looking statements are
qualified in their entirety by cautionary statements and risk factor
disclosures contained in the Company’s
Use of Non-GAAP Financial Measures
We provide in this press release (1) Currency Neutral Sales, (2)
Adjusted Operating Profit and Currency Neutral Adjusted Operating Profit
and (3) Adjusted EPS and Currency Neutral Adjusted EPS, which exclude
restructuring costs and other significant items of a non-recurring
and/or nonoperational nature such as legal charges/credits, gain on sale
of assets, operational improvement initiatives, integration costs,
Meet IFF
|
International Flavors & Fragrances Inc. Consolidated Income Statement (Amounts in thousands except per share data) (Unaudited) |
||||||||||||||
| Three Months Ended March 31, | ||||||||||||||
| 2018 | 2017 | % Change | ||||||||||||
| Net sales | $ | 930,928 | $ | 828,293 | 12 | % | ||||||||
| Cost of goods sold | 525,119 | 465,210 | 13 | % | ||||||||||
| Gross profit | 405,809 | 363,083 | 12 | % | ||||||||||
| Research and development expenses | 78,476 | 72,126 | 9 | % | ||||||||||
| Selling and administrative expenses | 142,644 | 143,704 | (1 | )% | ||||||||||
| Amortization of acquisition-related intangibles | 9,185 | 7,066 | 30 | % | ||||||||||
| Restructuring and other charges, net | 717 | 10,143 | (93 | )% | ||||||||||
| Gain on sales of fixed assets | (69 | ) | (21 | ) | 229 | % | ||||||||
| Operating profit | 174,856 | 130,065 | 34 | % | ||||||||||
| Interest expense | 16,595 | 12,807 | 30 | % | ||||||||||
| Other (income), net | (576 | ) | (21,229 | ) | (97 | )% | ||||||||
| Income before taxes | 158,837 | 138,487 | 15 | % | ||||||||||
| Taxes on income | 29,421 | 22,723 | 29 | % | ||||||||||
| Net income | $ | 129,416 | $ | 115,764 | 12 | % | ||||||||
| Earnings per share - basic | $ | 1.63 | $ | 1.46 | ||||||||||
| Earnings per share - diluted | $ | 1.63 | $ | 1.45 | ||||||||||
| Average shares outstanding | ||||||||||||||
| Basic | 79,018 | 79,098 | ||||||||||||
| Diluted | 79,393 | 79,409 | ||||||||||||
|
International Flavors & Fragrances Inc. Condensed Consolidated Balance Sheet (Amounts in thousands) (Unaudited) |
||||||||
| March 31, | December 31, | |||||||
| 2018 | 2017 | |||||||
| Cash and cash equivalents | $ | 305,276 | $ | 368,046 | ||||
| Receivables | 734,378 | 663,663 | ||||||
| Inventories | 687,817 | 649,448 | ||||||
| Other current assets | 242,870 | 215,387 | ||||||
| Total current assets | 1,970,341 | 1,896,544 | ||||||
| Property, plant and equipment, net | 887,483 | 880,580 | ||||||
| Goodwill and other intangibles, net | 1,580,077 | 1,572,075 | ||||||
| Other assets | 243,375 | 249,727 | ||||||
| Total assets | $ | 4,681,276 | $ | 4,598,926 | ||||
|
Bank borrowings and overdrafts, |
||||||||
| of long-term debt | $ | 36,819 | $ | 6,966 | ||||
| Other current liabilities | 679,933 | 761,802 | ||||||
| Total current liabilities | 716,752 | 768,768 | ||||||
| Long-term debt | 1,676,211 | 1,632,186 | ||||||
| Non-current liabilities | 509,351 | 508,678 | ||||||
| Shareholders' equity | 1,778,962 | 1,689,294 | ||||||
| Total liabilities and shareholders' equity | $ | 4,681,276 | $ | 4,598,926 | ||||
|
International Flavors & Fragrances Inc. Consolidated Statement of Cash Flows (Amounts in thousands) (Unaudited) |
|||||||||
| Three Months Ended March 31, | |||||||||
| 2018 | 2017 | ||||||||
| Cash flows from operating activities: | |||||||||
| Net income | $ | 129,416 | $ | 115,764 | |||||
| Adjustments to reconcile to net cash provided by operating activities: | |||||||||
| Depreciation and amortization | 33,384 | 26,802 | |||||||
| Deferred income taxes | 18,404 | (3,766 | ) | ||||||
| Gain on disposal of assets | (69 | ) | (21 | ) | |||||
| Stock-based compensation | 7,620 | 5,819 | |||||||
| Pension contributions | (4,387 | ) | (25,263 | ) | |||||
| Product Recall Claim Settlement | (12,969 | ) | — | ||||||
| Foreign currency gain on liquidation of entity | — | (12,214 | ) | ||||||
| Changes in assets and liabilities, net of acquisitions: | |||||||||
| Trade receivables | (61,301 | ) | (60,858 | ) | |||||
| Inventories | (30,185 | ) | (109 | ) | |||||
| Accounts payable | (8,435 | ) | (1,978 | ) | |||||
| Accruals for incentive compensation | (36,583 | ) | (23,485 | ) | |||||
| Other current payables and accrued expenses | (18,540 | ) | (7,586 | ) | |||||
| Other assets | (26,035 | ) | 30,284 | ||||||
| Other liabilities | (1,715 | ) | (24,894 | ) | |||||
| Net cash (used in) provided by operating activities | (11,395 | ) | 18,495 | ||||||
| Cash flows from investing activities: | |||||||||
| Cash paid for acquisitions, net of cash received | (22 | ) | (138,093 | ) | |||||
| Additions to property, plant and equipment | (33,105 | ) | (26,662 | ) | |||||
| Maturity of net investment hedges | (2,405 | ) | 1,948 | ||||||
| Proceeds from disposal of assets | 293 | 619 | |||||||
| Net cash used in investing activities | (35,239 | ) | (162,188 | ) | |||||
| Cash flows from financing activities: | |||||||||
| Cash dividends paid to shareholders | (54,420 | ) | (50,677 | ) | |||||
| Increase in revolving credit facility borrowings and overdrafts | 23,762 | 100,481 | |||||||
| Increase in commercial paper | 29,926 | 107,441 | |||||||
| Gain (Loss) on pre-issuance hedges | — | 300 | |||||||
| Employee withholding taxes paid | (3,266 | ) | (3,000 | ) | |||||
| Purchase of treasury stock | (10,617 | ) | (37,612 | ) | |||||
| Net cash (used in) provided by financing activities | (14,615 | ) | 116,933 | ||||||
| Effect of exchange rates changes on cash and cash equivalents | (1,521 | ) | 2,835 | ||||||
| Net change in cash and cash equivalents | (62,770 | ) | (23,925 | ) | |||||
| Cash and cash equivalents at beginning of year | 368,046 | 323,992 | |||||||
| Cash and cash equivalents at end of period | $ | 305,276 | $ | 300,067 | |||||
|
International Flavors & Fragrances Inc. Business Unit Performance (Amounts in thousands) (Unaudited) |
||||||||||
| Three Months Ended March 31, | ||||||||||
| 2018 | 2017 | |||||||||
| Net Sales | ||||||||||
| Flavors | $ | 449,019 | $ | 406,164 | ||||||
| Fragrances | 481,909 | 422,129 | ||||||||
| Consolidated | 930,928 | 828,293 | ||||||||
| Segment Profit | ||||||||||
| Flavors | 111,564 | 94,556 | ||||||||
| Fragrances | 93,277 | 77,875 | ||||||||
| Global Expenses | (23,825 | ) | (16,293 | ) | ||||||
| Operational Improvement Initiatives | (1,026 | ) | (621 | ) | ||||||
| Acquisition Related Costs | 514 | (8,788 | ) | |||||||
| Integration Related Costs | — | (1,192 | ) | |||||||
| Tax Assessment | — | (5,350 | ) | |||||||
| Restructuring and Other Charges, net | (717 | ) | (10,143 | ) | ||||||
| Gain on Sale of Assets | 69 | 21 | ||||||||
| FDA Mandated Product Recall | (5,000 | ) | — | |||||||
| Operating profit | 174,856 | 130,065 | ||||||||
| Interest Expense | (16,595 | ) | (12,807 | ) | ||||||
| Other income (expense), net | 576 | 21,229 | ||||||||
| Income before taxes | $ | 158,837 | $ | 138,487 | ||||||
| Operating Margin | ||||||||||
| Flavors | 24.8 | % | 23.3 | % | ||||||
| Fragrances | 19.4 | % | 18.4 | % | ||||||
| Consolidated | 18.8 | % | 15.7 | % | ||||||
|
International Flavors & Fragrances Inc. Sales Performance by Region and Category (Unaudited) |
||||||||||||||||||||
| First Quarter 2018 vs. First Quarter 2017 | ||||||||||||||||||||
| Percentage Change in Sales by Region of Destination | ||||||||||||||||||||
| Fine |
Consumer |
Ingredients | Total Frag. | Flavors | Total | |||||||||||||||
| North America | Reported | 10% | 13% | 6% | 11% | 10% | 10% | |||||||||||||
| EAME | Reported | 7% | 19% | 28% | 17% | 24% | 20% | |||||||||||||
| Currency Neutral | -5% | 5% | 15% | 4% | 11% | 7% | ||||||||||||||
| Latin America | Reported | 37% | 3% | 26% | 11% | -2% | 6% | |||||||||||||
| Currency Neutral | 35% | 3% | 24% | 11% | -2% | 6% | ||||||||||||||
| Greater Asia | Reported | -15% | 8% | 56% | 14% | 6% | 9% | |||||||||||||
| Currency Neutral | -17% | 5% | 49% | 11% | 2% | 6% | ||||||||||||||
| Total | Reported | 12% | 11% | 26% | 14% | 11% | 12% | |||||||||||||
| Currency Neutral | 4% | 6% | 18% | 8% | 6% | 7% | ||||||||||||||
Currency neutral growth is calculated by translating prior year sales at the exchange rates used for the corresponding 2018 period.
|
International Flavors & Fragrances Inc. GAAP to Non-GAAP Reconciliation Foreign Exchange Impact (Unaudited) |
|||||||||
|
Q1 Consolidated |
Sales |
Operating |
EPS | ||||||
| % Change - Reported (GAAP) | 12% | 34% | 12% | ||||||
| Items Impacting Comparability | 0% | -19% | -1% | ||||||
| % Change - Adjusted (Non-GAAP) | 12% | 16%* | 11% | ||||||
| Currency Impact | -5% | -4% | 1% | ||||||
| % Change - Currency Neutral (Adjusted) | 7% | 12% | 12% | ||||||
|
Q1 Flavors |
Sales |
Segment |
|||||||
| % Change - Reported (GAAP) | 11% | 18% | |||||||
| Currency Impact | -4% | -3% | |||||||
| % Change - Currency Neutral | 6%* | 15% | |||||||
|
Q1 Fragrances |
Sales |
Segment |
|||||||
| % Change - Reported (GAAP) | 14% | 20% | |||||||
| Currency Impact | -6% | -8% | |||||||
| % Change - Currency Neutral | 8% | 12% | |||||||
*Item does not foot due to rounding
|
International Flavors & Fragrances Inc. |
|
GAAP to Non-GAAP Reconciliation |
|
(Amounts in thousands) |
|
(Unaudited) |
The following information and schedules provide reconciliation information between reported GAAP amounts and non-GAAP certain adjusted amounts. This information and schedules are not intended as, and should not be viewed as, a substitute for reported GAAP amounts or financial statements of the Company prepared and presented in accordance with GAAP.
| Reconciliation of Gross Profit | ||||||||||
| First Quarter | ||||||||||
| (DOLLARS IN THOUSANDS) | 2018 | 2017 | ||||||||
| Reported (GAAP) | $ | 405,809 | $ | 363,083 | ||||||
| Operational Improvement Initiatives (a) | 453 | 621 | ||||||||
| Acquisition Related Costs (b) | — | 5,301 | ||||||||
| Integration Related Costs (c) | — | 88 | ||||||||
| FDA Mandated Product Recall (g) | 5,000 | — | ||||||||
| Adjusted (Non-GAAP) | $ | 411,262 | $ | 369,093 | ||||||
| Reconciliation of Selling and Administrative Expenses | ||||||||||
| First Quarter | ||||||||||
| (DOLLARS IN THOUSANDS) | 2018 | 2017 | ||||||||
| Reported (GAAP) | $ | 142,644 | $ | 143,704 | ||||||
| Acquisition Related Costs (b) | 514 | (3,487 | ) | |||||||
| Integration Related Costs (c) | — | (943 | ) | |||||||
| Tax Assessment (d) | — | (5,350 | ) | |||||||
| Adjusted (Non-GAAP) | $ | 143,158 | $ | 133,924 | ||||||
| Reconciliation of Operating Profit | ||||||||||
| First Quarter | ||||||||||
| (DOLLARS IN THOUSANDS) | 2018 | 2017 | ||||||||
| Reported (GAAP) | $ | 174,856 | $ | 130,065 | ||||||
| Operational Improvement Initiatives (a) | 1,026 | 621 | ||||||||
| Acquisition Related Costs (b) | (514 | ) | 8,788 | |||||||
| Integration Related Costs (c) | — | 1,192 | ||||||||
| Tax Assessment (d) | — | 5,350 | ||||||||
| Restructuring and Other Charges, net (e) | 717 | 10,143 | ||||||||
| Gain on Sale of Assets | (69 | ) | (21 | ) | ||||||
| FDA Mandated Product Recall (g) | 5,000 | — | ||||||||
| Adjusted (Non-GAAP) | $ | 181,016 | $ | 156,138 | ||||||
|
International Flavors & Fragrances Inc. |
|
GAAP to Non-GAAP Reconciliation |
|
(Amounts in thousands) |
|
(Unaudited) |
The following information and schedules provide reconciliation information between reported GAAP amounts and non-GAAP certain adjusted amounts. This information and schedules are not intended as, and should not be viewed as, a substitute for reported GAAP amounts or financial statements of the Company prepared and presented in accordance with GAAP.
| Reconciliation of Net Income | ||||||||||||||||||||||||||||||||||||||||
| First Quarter | ||||||||||||||||||||||||||||||||||||||||
| 2018 | 2017 | |||||||||||||||||||||||||||||||||||||||
| (DOLLARS IN THOUSANDS) | Income before taxes | Taxes on income (i) | Net income | EPS (j) | Income before taxes | Taxes on income (i) | Net income | EPS | ||||||||||||||||||||||||||||||||
| Reported (GAAP) | $ | 158,837 | $ | 29,421 | $ | 129,416 | $ | 1.63 | $ | 138,487 | $ | 22,723 | $ | 115,764 | $ | 1.45 | ||||||||||||||||||||||||
| Operational Improvement Initiatives (a) | 1,026 | 294 | 732 | 0.01 | 621 | 155 | 466 | 0.01 | ||||||||||||||||||||||||||||||||
| Acquisition Related Costs (b) | (514 | ) | (134 | ) | (380 | ) | — | 8,788 | 3,138 | 5,650 | 0.07 | |||||||||||||||||||||||||||||
| Integration Related Costs (c) | — | — | — | — | 1,191 | 362 | 829 | 0.01 | ||||||||||||||||||||||||||||||||
| Tax Assessment (d) | — | — | — | — | 5,350 | 1,892 | 3,458 | 0.04 | ||||||||||||||||||||||||||||||||
| Restructuring and Other Charges, net (e) | 717 | 169 | 548 | 0.01 | 10,143 | 2,967 | 7,176 | 0.09 | ||||||||||||||||||||||||||||||||
| Gain on Sale of Assets | (69 | ) | (17 | ) | (52 | ) | — | (21 | ) | (7 | ) | (14 | ) | — | ||||||||||||||||||||||||||
| CTA Realization (f) | — | — | — | — | (12,214 | ) | — | (12,214 | ) | (0.15 | ) | |||||||||||||||||||||||||||||
| FDA Mandated Product Recall (g) | 5,000 | 1,196 | 3,804 | 0.05 | — | — | — | — | ||||||||||||||||||||||||||||||||
| U.S. Tax Reform (h) | — | (649 | ) | 649 | 0.01 | — | — | — | — | |||||||||||||||||||||||||||||||
| Adjusted (Non-GAAP) | $ | 164,997 | $ | 30,280 | $ | 134,717 | $ | 1.69 | $ | 152,345 | $ | 31,230 | $ | 121,115 | $ | 1.52 | ||||||||||||||||||||||||
| (a) | For 2018, represents accelerated depreciation related to a plant relocation in India and a lab closure in Taiwan. For 2017, represents accelerated depreciation and idle labor costs in Hangzhou, China. | |
| (b) | For 2018, represents adjustments to the contingent consideration payable for PowderPure and transaction costs related to Fragrance Resources and PowderPure within Selling and administrative expenses. For 2017, represents the amortization of inventory "step-up" related to the acquisitions of David Michael and Fragrance Resources, included in cost of goods sold and transaction costs related to the acquisitions of David Michael, Fragrance Resources and PowderPure, included in Selling and administrative expenses. | |
| (c) | Represents costs related to the integration of the David Michael and Fragrance Resources acquisitions. | |
| (d) | Represents the reserve for payment of a tax assessment related to commercial rent for prior periods. | |
| (e) | Represents severance costs related to the 2017 Productivity Program and Taiwan lab closure. | |
| (f) | Represents the release of CTA related to the liquidation of a foreign entity. | |
| (g) | Represents management's best estimate of losses related to the previously disclosed FDA mandated recall. | |
| (h) | Represents charges incurred related to enactment of certain U.S. tax legislation changes in December 2017. | |
| (i) | The income tax expense (benefit) on non-GAAP adjustments is computed in accordance with ASC 740 using the same methodology as the GAAP provision of income taxes. Income tax effects of non-GAAP adjustments are calculated based on the applicable statutory tax rate for each jurisdiction in which such charges were incurred, except for those items which are non-taxable for which the tax expense (benefit) was calculated at 0%. For first quarter of 2018, these non-GAAP adjustments were not subject to foreign tax credits or valuation allowances, but to the extent that such factors are applicable to any future non-GAAP adjustments we will take such factors into consideration in calculating the tax expense (benefit). | |
| (j) | The sum of these items does not foot due to rounding. | |
| The Company tracks the amount of amortization recorded on recent acquisitions in order to monitor its progress with respect to its Vision 2020 goals. The following amounts were recorded with respect to recent acquisitions: $0.7M related to PowderPure, $2.0M related to Fragrance Resources, $1.1M related to David Michael, $1.6M related to Ottens Flavors, and $2.0M related to Lucas Meyer Cosmetics. |
View source version on businesswire.com: https://www.businesswire.com/news/home/20180506005087/en/
Source:
International Flavors & Fragrances Inc.
Michael DeVeau,
212-708-7164
VP, Corporate Strategy, Investor Relations &
Communications
Michael.DeVeau@iff.com