

IFF Reports Third Quarter 2018 Results
Strong financial performance during historic quarter
This press release features multimedia. View the full release here: https://www.businesswire.com/news/home/20181105005979/en/
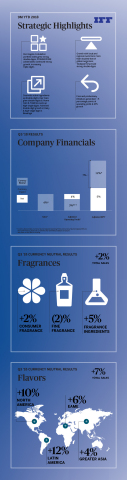
IFF Q3 2018 Infographic (Graphic: Business Wire)
Nine Months Year-To-Date 2018 Consolidated Summary: Change vs. Prior Year
| Reported (GAAP) | Adjusted (Non-GAAP)¹ | Currency Neutral (Non-GAAP)¹ | ||||||||||||||||
| Sales | Operating Profit | EPS | Sales | Operating Profit | EPS | Sales | Operating Profit | EPS | ||||||||||
| Consolidated | 8% | 13% | (4)% | 8% | 8% | 9% | 6% | 4% | 11% | |||||||||
Third Quarter 2018 Consolidated Summary: Change vs. Prior Year
| Reported (GAAP) | Adjusted (Non-GAAP)¹ | Currency Neutral (Non-GAAP)¹ | ||||||||||||||||
| Sales | Operating Profit | EPS | Sales | Operating Profit | EPS | Sales | Operating Profit | EPS | ||||||||||
| Consolidated | 4% | 7% | (16)% | 4% | 4% | 5% | 4% | 3% | 12% | |||||||||
¹ Schedules at the end of this release contain reconciliations of
reported GAAP to non-GAAP metrics.
2Excludes
Frutarom results as the transaction closed in the fourth quarter 2018.
Management Commentary
“In 1958,
“We are now embarking on the next major chapter of IFF’s history, following the completion of the Frutarom transaction in early October. We believe that our combination with Frutarom, the largest transaction of its kind in our industry, is fundamentally going to expand our customer and employee base and product offerings. We will have greater exposure to fast-growing customers, broader access to attractive adjacencies and a differentiated portfolio with an increased focus on naturals and health and wellness as well as more comprehensive solutions. We believe this will translate into accelerated financial performance as a combined company, with robust top and bottom-line growth, leading to strong returns for our shareholders.
“With all this change comes the bittersweet realization that the third quarter 2018 was our final as legacy IFF. I’m pleased to say we continued to deliver strong results to our shareholders. Against a very strong year-ago performance, top-line trends remained solid – growing 4%. Performance was broad-based – led by new wins and pricing to compensate rising raw material costs – with both business units contributing to results. Bottom-line performance was also strong, as we achieved a double-digit currency neutral adjusted EPS growth. Looking forward, we are excited about the prospects of this historic combination of two world-class companies, entering a new chapter of profitable growth and shareholder value creation.”
Third Quarter 2018 Consolidated Financial Results
-
Reported net sales for the third quarter totaled
$908 million , an increase of 4% from$873 million in 2017. Excluding the impact of foreign exchange, currency neutral sales increased 4% over the prior year. -
Reported operating profit for the third quarter was
$159 million versus$149 million reported in 2017, an increase of 7%. Excluding the impact of foreign exchange and those items that affect comparability, currency neutral adjusted operating profit increased by 3%. -
Reported earnings per share (EPS) for the third quarter was
$1.17 per diluted share versus$1.39 per diluted share reported in 2017. Excluding the impact of foreign exchange and those items that affect comparability, currency neutral adjusted EPS improved 12%.
Third Quarter 2018 Segment Summary: Growth vs. Prior Year
| Reported (GAAP) | Currency Neutral (Non-GAAP) | ||||||||
| Sales | Segment Profit | Sales | Segment Profit | ||||||
| Flavors | 6% | 10% | 7% | 7% | |||||
| Fragrances | 2% | (2)% | 2% | (5)% | |||||
Flavors Business Unit
-
On a reported basis, sales increased 6%, or
$26.4 million , to$436.2 million . Currency neutral sales grew 7%, against a strong year-ago comparison, driven by growth in all categories and all regions. -
EAME increased 7% on a reported basis and 6% on a currency neutral
basis, as
Europe ,Africa and theMiddle East all grew high-single-digits. Growth was achieved across all categories, led by strong performances in Dairy, Beverage and Sweet. North America improved 10% driven by strong performances in Dairy & Sweet and double-digit growth at Tastepoint℠.Latin America increased 6% on a reported basis and 12% on a currency neutral basis driven by strong double-digit growth inArgentina and mid-single-digit growth inMexico . On a category basis, strong double-digit growth was achieved in Savory and Dairy as well as high-single digit growth in Beverage.Greater Asia increased 3% on a reported basis and 4% on a currency neutral basis led by strong growth inIndia . Growth was achieved in most categories, led by strong double-digit growth in Beverage.- Flavors segment profit increased 10% on a reported basis and 7% on a currency neutral basis, driven primarily by volume growth and the benefits from productivity initiatives.
Fragrances Business Unit
-
On a reported basis, sales increased 2%, or
$8.2 million , to$471.3 million . Currency neutral sales improved 2% on a strong double-digit year-ago comparison, with growth in nearly all regions. - Fine Fragrances decreased 3% on a reported basis and 2% on a currency neutral basis, as strong new win performance was offset by volume softness due to a strong year-ago comparison.
- Consumer Fragrances grew 2% on a reported basis and currency neutral basis. Performance was driven by continued growth in Hair, Home and Fabric Care. On a geographic basis, nearly all regions contributed positively to results.
- Fragrance Ingredients grew 6% on a reported basis and 5% on a currency neutral basis, led by strong double-digit growth in cosmetic active ingredients and continued growth in Fragrance Ingredients.
- Fragrances segment profit decreased 2% on a reported basis and 5% on a currency neutral basis as the benefits from productivity initiatives and cost management were more than offset by unfavorable price to input costs, including the previously announced citral supply issue.
Frutarom Transaction Update
-
On
October 4, 2018 , completed the combination with Frutarom to establish a global leader in taste, scent and nutrition. - For purposes of calculating diluted EPS in the fourth quarter of 2018, we estimate that there will be a total of approximately 113 million shares to be included in the EPS calculation. This estimate includes 6.3 million tangible equity units. In the third quarter 2018, diluted EPS was impacted by approximately 2.2 million shares given the timing of the equity raise. There was no contribution of earnings from Frutarom in the third quarter of 2018.
-
Interest expense following the completion of the
$2.8 billion debt raise is expected to be approximately$150 - $155 million . In the third quarter 2018, Net Income was impacted by approximately$1.6 million given the timing of the debt raise. -
The following estimated Frutarom results are shown for informational
purposes only, they reflect Frutarom’s results when it was under
previous ownership and prior to our acquisition of Frutarom on
October 4, 2018 . Frutarom’s financial data has historically been prepared under International Financial Reporting Standards (“IFRS”), and not U.S. GAAP and the numbers below were prepared under IFRS. Consequently, these results do not necessarily reflect actual results as if Frutarom had been included in our results for the third quarter of 2018.-
Net sales for the third quarter of 2018 are expected to be between
$360 and $365 million , and adjusted EBITDA margin is expected to be approximately 21%.
-
Net sales for the third quarter of 2018 are expected to be between
The Company’s full year 2018 guidance (excluding items impacting comparability) including Frutarom’s results beginning in the fourth quarter 2018 is as follows:
| Guidance | ||
| Sales | $3.95B - $4.05B | |
| Adjusted EPS* |
$6.25 - $6.45 |
1 See Use of Non-GAAP Financial Measures
*
Adjusted EPS is a Non-GAAP metric that excludes restructuring costs and
other significant items of a non-recurring and/or nonoperational nature,
foreign currency movements, and full amortization for the Company
A copy of the Company’s Quarterly Report on Form 10-Q will be available
on its website at www.iff.com
or at www.sec.gov
by
Audio Webcast
A live webcast to discuss the Company’s third quarter 2018 financial
results will be held on
Cautionary Statement Under The Private Securities Litigation Reform Act of 1995
This press release includes “forward-looking statements” under the
Federal Private Securities Litigation Reform Act of 1995, including
statements regarding our outlook in our full year 2018 guidance, the
expected impact of the combination with Frutarom, including expected
increase in our portfolio and our customer base, on future growth and
accelerated performance and our ability to deliver growth across all of
our key financial metrics, and the impact of our actions on value
creation for our shareholders. These forward-looking statements are
qualified in their entirety by cautionary statements and risk factor
disclosures contained in the Company’s
Use of Non-GAAP Financial Measures
We provide in this press release (1) Currency Neutral Sales, (2)
Adjusted Operating Profit and Currency Neutral Adjusted Operating Profit
and (3) Adjusted EPS and Currency Neutral Adjusted EPS, which exclude
restructuring costs and other significant items of a non-recurring
and/or nonoperational nature such as legal charges/credits, gains on
sale of assets, tax assessment, operational improvement initiatives,
integration related costs,
Meet IFF
|
International Flavors & Fragrances Inc. Consolidated Income Statement (Amounts in thousands except per share data) (Unaudited) |
||||||||||||
| Three Months Ended September 30, | Nine Months Ended September 30, | |||||||||||
| 2018 | 2017 | % Change | 2018 | 2017 | % Change | |||||||
| Net sales | $907,548 | $872,940 | 4% | $2,758,492 | $2,544,094 | 8% | ||||||
| Cost of goods sold | 506,882 | 492,542 | 3% | 1,553,300 | 1,427,630 | 9% | ||||||
| Gross profit | 400,666 | 380,398 | 5% | 1,205,192 | 1,116,464 | 8% | ||||||
| Research and development expenses | 75,302 | 73,762 | 2% | 228,545 | 218,649 | 5% | ||||||
| Selling and administrative expenses | 157,796 | 145,652 | 8% | 457,847 | 428,675 | 7% | ||||||
| Amortization of acquisition-related intangibles | 9,003 | 8,766 | 3% | 27,772 | 24,327 | 14% | ||||||
| Restructuring and other charges, net | 927 | 3,249 | -71% | 2,830 | 14,183 | -80% | ||||||
| Gains on sales of fixed assets | (1,630) | (31) | 5158% | (435) | (120) | 263% | ||||||
| Operating profit | 159,268 | 149,000 | 7% | 488,633 | 430,750 | 13% | ||||||
| Interest expense | 23,914 | 19,221 | 24% | 93,755 | 49,584 | 89% | ||||||
| Loss on extinguishment of debt | 38,810 | - | N/A | 38,810 | - | N/A | ||||||
| Other income, net | (4,158) | (11,547) | -64% | (25,389) | (40,687) | -38% | ||||||
| Income before taxes | 100,702 | 141,326 | -29% | 381,457 | 421,853 | -10% | ||||||
| Taxes on income | 4,986 | 31,065 | -84% | 57,176 | 86,033 | -34% | ||||||
| Net income | $ 95,716 | $110,261 | -13% | $ 324,281 | $ 335,820 | -3% | ||||||
| Earnings per share - basic | $ 1.18 | $ 1.39 | $ 4.06 | $ 4.24 | ||||||||
| Earnings per share - diluted | $ 1.17 | $ 1.39 | $ 4.04 | $ 4.22 | ||||||||
| Average shares outstanding | ||||||||||||
| Basic | 81,263 | 79,063 | 79,783 | 79,072 | ||||||||
| Diluted | 81,647 | 79,362 | 80,115 | 79,353 | ||||||||
|
International Flavors & Fragrances Inc. Condensed Consolidated Balance Sheet (Amounts in thousands) (Unaudited) |
||||
| September 30, | December 31, | |||
| 2018 | 2017 | |||
| Cash and cash equivalents | $ 5,274,459 | $ 368,046 | ||
| Receivables | 701,111 | 663,663 | ||
| Inventories | 719,508 | 649,448 | ||
| Other current assets | 251,749 | 215,387 | ||
| Total current assets | 6,946,827 | 1,896,544 | ||
| Property, plant and equipment, net | 874,817 | 880,580 | ||
| Goodwill and other intangibles, net | 1,538,439 | 1,572,075 | ||
| Other assets | 255,459 | 249,727 | ||
| Total assets | $ 9,615,542 | $ 4,598,926 | ||
| Short term borrowings | $ 45,985 | $ 6,966 | ||
| Other current liabilities | 712,471 | 761,802 | ||
| Total current liabilities | 758,456 | 768,768 | ||
| Long-term debt | 4,331,242 | 1,632,186 | ||
| Non-current liabilities | 487,895 | 508,678 | ||
| Shareholders' equity | 4,037,949 | 1,689,294 | ||
| Total liabilities and shareholders' equity | $ 9,615,542 | $ 4,598,926 | ||
|
International Flavors & Fragrances Inc. Consolidated Statement of Cash Flows (Amounts in thousands) (Unaudited) |
||||
| Nine Months Ended September 30, | ||||
| 2018 | 2017 | |||
| Cash flows from operating activities: | ||||
| Net income | $ 324,281 | $ 335,820 | ||
| Adjustments to reconcile to net cash provided by operating activities: | ||||
| Depreciation and amortization | 95,994 | 85,446 | ||
| Deferred income taxes | 20,623 | (3,439) | ||
| Gains on sale of assets | (435) | (120) | ||
| Stock-based compensation | 22,041 | 20,149 | ||
| Pension contributions | (15,983) | (36,870) | ||
| Loss on extinguishment of debt | 38,810 | - | ||
| Gain on deal contingent derivatives | (12,505) | - | ||
| Litigation settlement | - | (56,000) | ||
| Product recall claim settlement, net of insurance proceeds received | (3,090) | - | ||
| Foreign currency gain on liquidation of entity | - | (12,214) | ||
| Changes in assets and liabilities, net of acquisitions: | ||||
| Trade receivables | (93,198) | (94,945) | ||
| Inventories | (92,705) | 6,211 | ||
| Accounts payable | (17,198) | (20,560) | ||
| Accruals for incentive compensation | (10,753) | 2,907 | ||
| Other current payables and accrued expenses | 386 | 9,423 | ||
| Other assets | (61,597) | 3,824 | ||
| Other liabilities | 7,287 | (40,143) | ||
| Net cash provided by operating activities | 201,958 | 199,489 | ||
| Cash flows from investing activities: | ||||
| Cash paid for acquisitions, net of cash received | (22) | (191,304) | ||
| Additions to property, plant and equipment | (102,421) | (77,318) | ||
| Proceeds from life insurance contracts | 1,837 | 1,941 | ||
| Maturity of net investment hedges | (2,642) | 2,226 | ||
| Proceeds from disposal of assets | 961 | 1275 | ||
| Net cash used in investing activities | (102,287) | (263,180) | ||
| Cash flows from financing activities: | ||||
| Cash dividends paid to shareholders | (163,318) | (151,678) | ||
| Increase in revolving credit facility and short term borrowings | 112,483 | 35,998 | ||
| Proceeds from sales of equity securities, net of issuance costs | 2,268,965 | - | ||
| Deferred financing costs | (21,944) | (5,373) | ||
| Repayments on debt | (288,810) | (250,000) | ||
| Proceeds from issuance of long-term debt | 2,926,414 | 498,250 | ||
| Gain (loss) on pre-issuance hedges | 12,505 | (5,310) | ||
| Proceeds from issuance of stock in connection with stock options | - | 329 | ||
| Employee withholding taxes paid | (9,725) | (11,509) | ||
| Purchase of treasury stock | (15,475) | (53,211) | ||
| Net cash provided by financing activities | 4,821,095 | 57,496 | ||
| Effect of exchange rates changes on cash and cash equivalents | (14,353) | (1,795) | ||
| Net change in cash and cash equivalents | 4,906,413 | (7,990) | ||
| Cash and cash equivalents at beginning of year | 368,046 | 323,992 | ||
| Cash and cash equivalents at end of period | $ 5,274,459 | $ 316,002 | ||
|
International Flavors & Fragrances Inc. Business Unit Performance (Amounts in thousands) (Unaudited) |
||||||||
| Three Months Ended September 30, | Nine Months Ended September 30, | |||||||
| 2018 | 2017 | 2018 | 2017 | |||||
| Net Sales | ||||||||
| Flavors | $436,214 | $409,800 | $1,335,773 | $1,230,286 | ||||
| Fragrances | 471,334 | 463,140 | 1,422,719 | 1,313,808 | ||||
| Consolidated | 907,548 | 872,940 | 2,758,492 | 2,544,094 | ||||
| Segment Profit | ||||||||
| Flavors | 96,497 | 87,375 | 317,666 | 278,768 | ||||
| Fragrances | 87,488 | 88,959 | 261,545 | 247,824 | ||||
| Global Expenses | (19,578) | (17,693) | (63,975) | (47,472) | ||||
| Operational Improvement Initiatives | (344) | (407) | (1,773) | (1,473) | ||||
| Acquisition Related Costs | 1 | (5,436) | 519 | (20,502) | ||||
| Integration Related Costs | (958) | (580) | (1,951) | (2,501) | ||||
| Legal Charges/Credits, net | - | - | - | (1,000) | ||||
| Tax Assessment | - | - | - | (5,331) | ||||
| Restructuring and Other Charges, net | (927) | (3,249) | (1,837) | (14,183) | ||||
| Gains on Sale of Assets | 1,630 | 31 | 435 | 120 | ||||
| FDA Mandated Product Recall | 9,800 | - | 4,800 | (3,500) | ||||
| Frutarom Acquisition Related Costs | (14,341) | - | (26,796) | - | ||||
| Operating profit | 159,268 | 149,000 | 488,633 | 430,750 | ||||
| Interest Expense | (23,914) | (19,221) | (93,755) | (49,584) | ||||
| Loss on extinguishment of debt | (38,810) | - | (38,810) | - | ||||
| Other income, net | 4,158 | 11,547 | 25,389 | 40,687 | ||||
| Income before taxes | $100,702 | $141,326 | $ 381,457 | $ 421,853 | ||||
| Operating Margin | ||||||||
| Flavors | 22.1% | 21.3% | 23.8% | 22.7% | ||||
| Fragrances | 18.6% | 19.2% | 18.4% | 18.9% | ||||
| Consolidated | 17.5% | 17.1% | 17.7% | 16.9% | ||||
|
International Flavors & Fragrances Inc. Sales Performance by Region and Category (Unaudited) |
|||||||||||||||
| Third Quarter 2018 vs. 2017 | |||||||||||||||
| Percentage Change in Sales by Region of Destination | |||||||||||||||
| Fine | Consumer Fragrances | Ingredients | Total Frag. | Flavors | Total | ||||||||||
| North America | Reported | -13% | 1% | 23% | 3% | 10% | 7% | ||||||||
| EAME | Reported | 3% | 2% | -4% | 1% | 7% | 3% | ||||||||
| Currency Neutral | 2% | 2% | -5% | 0% | 6% | 3% | |||||||||
| Latin America | Reported | -7% | -4% | -12% | -6% | 6% | -2% | ||||||||
| Currency Neutral | -3% | -3% | -11% | -4% | 12% | 1% | |||||||||
| Greater Asia | Reported | 21% | 8% | 14% | 9% | 3% | 6% | ||||||||
| Currency Neutral | 20% | 8% | 14% | 9% | 4% | 7% | |||||||||
| Total | Reported | -3% | 2% | 6% | 2% | 6% | 4% | ||||||||
| Currency Neutral | -2% | 2% | 5% | 2% | 7% | 4% | |||||||||
| First Nine Months 2018 vs. First Nine Months 2017 | |||||||||||||||
| Percentage Change in Sales by Region of Destination | |||||||||||||||
| Fine | Consumer Fragrances | Ingredients | Total Frag. | Flavors | Total | ||||||||||
| North America | Reported | -2% | 6% | 16% | 7% | 9% | 8% | ||||||||
| EAME | Reported | 7% | 11% | 10% | 10% | 15% | 12% | ||||||||
| Currency Neutral | -1% | 3% | 3% | 2% | 7% | 4% | |||||||||
| Latin America | Reported | 10% | 1% | 6% | 4% | 3% | 3% | ||||||||
| Currency Neutral | 13% | 1% | 5% | 4% | 6% | 5% | |||||||||
| Greater Asia | Reported | 1% | 8% | 35% | 12% | 5% | 8% | ||||||||
| Currency Neutral | -2% | 6% | 32% | 10% | 3% | 6% | |||||||||
| Total | Reported | 5% | 7% | 16% | 8% | 9% | 8% | ||||||||
| Currency Neutral | 1% | 4% | 11% | 5% | 6% | 6% | |||||||||
Currency neutral growth is calculated by translating prior year sales at the exchange rates used for the corresponding 2018 period.
|
International Flavors & Fragrances Inc. GAAP to Non-GAAP Reconciliation Foreign Exchange Impact (Unaudited) |
||||||
|
Q3 Consolidated |
Sales | Operating Profit | EPS | |||
| % Change - Reported (GAAP) | 4% | 7% | -16% | |||
| Items Impacting Comparability | 0% | -3% | 21% | |||
| % Change - Adjusted (Non-GAAP) | 4% | 4% | 5% | |||
| Currency Impact | 0% | 0% | 7% | |||
| % Change - Currency Neutral (Adjusted) | 4% | 3%* | 12% | |||
|
Q3 Flavors |
Sales | Segment Profit | ||||
| % Change - Reported (GAAP) | 6% | 10% | ||||
| Currency Impact | 1% | -3% | ||||
| % Change - Currency Neutral | 7% | 7% | ||||
|
Q3 Fragrances |
Sales | Segment Profit | ||||
| % Change - Reported (GAAP) | 2% | -2% | ||||
| Currency Impact | 0% | -3% | ||||
| % Change - Currency Neutral | 2% | -5% | ||||
|
9M YTD Consolidated |
Sales | Operating Profit | EPS | |||
| % Change - Reported (GAAP) | 8% | 13% | -4% | |||
| Items Impacting Comparability | 0% | -6% | 13% | |||
| % Change - Adjusted (Non-GAAP) | 8% | 8%* | 9% | |||
| Currency Impact | -3% | -3% | 2% | |||
| % Change - Currency Neutral (Adjusted) | 6%* | 4%* | 11% | |||
*Item does not foot due to rounding
GAAP to
Non-GAAP Reconciliation
(Amounts in thousands)
(Unaudited)
The following information and schedules provide reconciliation information between reported GAAP amounts and non-GAAP certain adjusted amounts. This information and schedules are not intended as, and should not be viewed as, a substitute for reported GAAP amounts or financial statements of the Company prepared and presented in accordance with GAAP.
| Reconciliation of Gross Profit | ||||
| Third Quarter | ||||
| 2018 | 2017 | |||
| Reported (GAAP) | $ 400,666 | $380,398 | ||
| Operational Improvement Initiatives (a) | 398 | 407 | ||
| Acquisition Related Costs (b) | - | 5,147 | ||
| Integration Related Costs (c) | 18 | 131 | ||
| FDA Mandated Product Recall (e) | (9,800) | - | ||
| Adjusted (Non-GAAP) | $ 391,282 | $386,083 | ||
| Reconciliation of Selling and Administrative Expenses | ||||
| Third Quarter | ||||
| 2018 | 2017 | |||
| Reported (GAAP) | $ 157,796 | $145,652 | ||
| Acquisition Related Costs (b) | 1 | (289) | ||
| Integration Related Costs (c) | (915) | (383) | ||
| Frutarom Acquisition Related Costs (g) | (14,341) | - | ||
| Adjusted (Non-GAAP) | $ 142,541 | $144,980 | ||
| Reconciliation of Operating Profit | ||||
| Third Quarter | ||||
| 2018 | 2017 | |||
| Reported (GAAP) | $ 159,268 | $149,000 | ||
| Operational Improvement Initiatives (a) | 344 | 407 | ||
| Acquisition Related Costs (b) | (1) | 5,436 | ||
| Integration Related Costs (c) | 958 | 580 | ||
| Restructuring and Other Charges, net (d) | 927 | 3,249 | ||
| Gains on Sale of Assets | (1,630) | (31) | ||
| FDA Mandated Product Recall (e) | (9,800) | - | ||
| Frutarom Acquisition Related Costs (g) | 14,341 | - | ||
| Adjusted (Non-GAAP) | $ 164,407 | $158,641 | ||
GAAP to
Non-GAAP Reconciliation
(Amounts in thousands)
(Unaudited)
The following information and schedules provide reconciliation information between reported GAAP amounts and non-GAAP certain adjusted amounts. This information and schedules are not intended as, and should not be viewed as, a substitute for reported GAAP amounts or financial statements of the Company prepared and presented in accordance with GAAP.
| Reconciliation of Net Income | ||||||||||||||||||
| Third Quarter | ||||||||||||||||||
| 2018 | 2017 | |||||||||||||||||
| Income before taxes | Taxes on income (h) | Net income | Diluted EPS | Income before taxes | Taxes on income (h) | Net income | Diluted EPS | |||||||||||
| Reported (GAAP) | $ 100,702 | $ 4,986 | $ 95,716 | $ 1.17 | $ 141,326 | $ 31,065 | $ 110,261 | $ 1.39 | ||||||||||
| Operational Improvement Initiatives (a) | 345 | 125 | 220 | - | 407 | 102 | 305 | - | ||||||||||
| Acquisition Related Costs (b) | (1) | 1 | (2) | - | 5,436 | 1,949 | 3,487 | 0.04 | ||||||||||
| Integration Related Costs (c) | 959 | 237 | 722 | 0.01 | 580 | 152 | 428 | 0.01 | ||||||||||
| Restructuring and Other Charges, net (d) | 927 | 228 | 699 | 0.01 | 3,249 | 1,012 | 2,237 | 0.03 | ||||||||||
| Gains on Sale of Assets | (1,630) | (387) | (1,243) | (0.02) | (31) | (10) | (21) | - | ||||||||||
| FDA Mandated Product Recall (e) | (9,800) | (2,344) | (7,456) | (0.09) | - | - | - | - | ||||||||||
| U.S. Tax Reform (f) | - | 8,151 | (8,151) | (0.10) | - | - | - | - | ||||||||||
| Frutarom Acquisition Related Costs (g) | 54,994 | 9,561 | 45,433 | 0.56 | - | - | - | - | ||||||||||
| Adjusted (Non-GAAP) | $ 146,496 | $ 20,558 | $ 125,938 | $ 1.54 | $ 150,967 | $ 34,270 | $ 116,697 | $ 1.47 | ||||||||||
| (a) | For 2018, represents accelerated depreciation related to a plant relocation in India and Taiwan asset write off. For 2017, represents accelerated depreciation and idle labor costs in Hangzhou, China. | |||||||||||||||||
| (b) | For 2017, represents the amortization of inventory "step-up" related to the acquisitions of David Michael, Fragrance Resources and PowderPure, included in cost of goods sold, and transaction costs related to the acquisitions of David Michael, Fragrance Resources and PowderPure, included in Selling and administrative expenses. | |||||||||||||||||
| (c) | For 2018, represents costs related to the integration of Frutarom. For 2017, represents costs related to the integration of David Michael and Fragrance Resources acquisitions. | |||||||||||||||||
| (d) | For 2018, represents severance costs related to the 2017 Productivity Program. For 2017, represents severance costs related to the 2017 Productivity Program which were partially offset by the reversal of 2015 severance charges that were no longer needed. | |||||||||||||||||
| (e) | Represents recoveries from the supplier related to the previously disclosed FDA mandated recall. | |||||||||||||||||
| (f) | Represents charges incurred related to enactment of certain U.S. tax legislation changes in December 2017. | |||||||||||||||||
| (g) | Represents transaction-related costs and expenses related to the acquisition of Frutarom. Amount primarily includes $28.8 million of bridge loan commitment fees partially offset by $25.3 million net mark-to-market gains on deal-contingent interest rate derivatives included in Interest expense; $34.9 million make whole payment on the Senior Notes - 2007 and $3.9 million realized loss on a fair value hedge included in Loss on extinguishment of debt; $1.9 million realized gain on a foreign currency derivative included in Other income; and $14.3 million of transaction costs included in administrative expenses. | |||||||||||||||||
| (h) | The income tax expense (benefit) on non-GAAP adjustments is computed in accordance with ASC 740 using the same methodology as the GAAP provision of income taxes. Income tax effects of non-GAAP adjustments are calculated based on the applicable statutory tax rate for each jurisdiction in which such charges were incurred, except for those items which are non-taxable for which the tax expense (benefit) was calculated at 0%. For third quarter of 2018, certain non-GAAP adjustments were subject to valuation allowances and therefore was calculated at 0%. | |||||||||||||||||
| The Company tracks the amount of amortization recorded on recent acquisitions in order to monitor its progress with respect to its Vision 2020 goals. The following amounts were recorded with respect to recent acquisitions: $0.7M related to PowderPure, $1.7M related to Fragrance Resources, $1.1M related to David Michael, $2.1M related to Lucas Meyer Cosmetics, and $1.6M related to Ottens Flavors | ||||||||||||||||||
GAAP to
Non-GAAP Reconciliation
(Amounts in thousands)
(Unaudited)
The following information and schedules provide reconciliation information between reported GAAP amounts and non-GAAP certain adjusted amounts. This information and schedules are not intended as, and should not be viewed as, a substitute for reported GAAP amounts or financial statements of the Company prepared and presented in accordance with GAAP.
| Reconciliation of Gross Profit | ||||
| Third Quarter Year-to-Date | ||||
| 2018 | 2017 | |||
| Reported (GAAP) | $ 1,205,192 | $1,116,464 | ||
| Operational Improvement Initiatives (a) | 1,254 | 1,473 | ||
| Acquisition Related Costs (b) | - | 16,055 | ||
| Integration Related Costs (c) | 18 | 316 | ||
| FDA Mandated Product Recall (h) | (4,800) | 3,500 | ||
| Adjusted (Non-GAAP) | $ 1,201,664 | $1,137,808 | ||
| Reconciliation of Selling and Administrative Expenses | ||||
| Third Quarter Year-to-Date | ||||
| 2018 | 2017 | |||
| Reported (GAAP) | $ 457,847 | $ 428,675 | ||
| Acquisition Related Costs (b) | 519 | (4,447) | ||
| Integration Related Costs (c) | (915) | (1,867) | ||
| Legal Charges/Credits, net (d) | - | (1,000) | ||
| Tax Assessment (e) | - | (5,331) | ||
| Frutarom Acquisition Related Costs (j) | (26,796) | - | ||
| Adjusted (Non-GAAP) | $ 430,655 | $ 416,030 | ||
| Reconciliation of Operating Profit | ||||
| Third Quarter Year-to-Date | ||||
| 2018 | 2017 | |||
| Reported (GAAP) | $ 488,633 | $ 430,750 | ||
| Operational Improvement Initiatives (a) | 1,773 | 1,473 | ||
| Acquisition Related Costs (b) | (519) | 20,502 | ||
| Integration Related Costs (c) | 1,951 | 2,501 | ||
| Legal Charges/Credits, net (d) | - | 1,000 | ||
| Tax Assessment (e) | - | 5,331 | ||
| Restructuring and Other Charges, net (f) | 1,837 | 14,183 | ||
| Gains on Sale of Assets | (435) | (120) | ||
| FDA Mandated Product Recall (h) | (4,800) | 3,500 | ||
| Frutarom Acquisition Related Costs (j) | 26,796 | - | ||
| Adjusted (Non-GAAP) | $ 515,236 | $ 479,120 | ||
GAAP to
Non-GAAP Reconciliation
(Amounts in thousands)
(Unaudited)
The following information and schedules provide reconciliation information between reported GAAP amounts and non-GAAP certain adjusted amounts. This information and schedules are not intended as, and should not be viewed as, a substitute for reported GAAP amounts or financial statements of the Company prepared and presented in accordance with GAAP.
| Reconciliation of Net Income | ||||||||||||||||||
| Third Quarter Year-to-Date | ||||||||||||||||||
| 2018 | 2017 | |||||||||||||||||
| Income before taxes | Taxes on income (k) | Net income | Diluted EPS (l) | Income before taxes | Taxes on income (k) | Net income | Diluted EPS | |||||||||||
| Reported (GAAP) | $ 381,457 | $ 57,176 | $ 324,281 | $ 4.04 | $ 421,853 | $ 86,033 | $ 335,820 | $ 4.22 | ||||||||||
| Operational Improvement Initiatives (a) | 1,774 | 561 | 1,213 | 0.02 | 1,473 | 368 | 1,105 | 0.01 | ||||||||||
| Acquisition Related Costs (b) | (519) | (134) | (385) | - | 20,502 | 6,559 | 13,943 | 0.18 | ||||||||||
| Integration Related Costs (c) | 1,952 | 237 | 1,715 | 0.02 | 2,501 | 757 | 1,744 | 0.02 | ||||||||||
| Legal Charges/Credits, net (d) | - | - | - | - | 1,000 | 354 | 646 | 0.01 | ||||||||||
| Tax Assessment (e) | - | - | - | - | 5,331 | 1,885 | 3,446 | 0.04 | ||||||||||
| Restructuring and Other Charges, net (f) | 1,837 | 443 | 1,394 | 0.02 | 14,183 | 3,904 | 10,279 | 0.13 | ||||||||||
| Gains on Sale of Assets | (435) | (141) | (294) | - | (120) | (39) | (81) | - | ||||||||||
| CTA Realization (g) | - | - | - | - | (12,214) | - | (12,214) | (0.15) | ||||||||||
| FDA Mandated Product Recall (h) | (4,800) | (1,148) | (3,652) | (0.05) | 3,500 | 1,238 | 2,262 | 0.03 | ||||||||||
| U.S. Tax Reform (i) | - | 7,502 | (7,502) | (0.09) | - | - | - | - | ||||||||||
| Frutarom Acquisition Related Costs (j) | 91,983 | 16,104 | 75,879 | 0.95 | - | - | - | - | ||||||||||
| Adjusted (Non-GAAP) | $ 473,249 | $ 80,600 | $ 392,649 | $ 4.89 | $ 458,009 | $ 101,059 | $ 356,950 | $ 4.49 | ||||||||||
| (a) | For 2018, represents accelerated depreciation related to a plant relocation in India and Taiwan asset write off. For 2017, represents accelerated depreciation and idle labor costs in Hangzhou, China. | |||||||||||||||||
| (b) | For 2018, represents adjustments to the contingent consideration payable for PowderPure, and transaction costs related to Fragrance Resources and PowderPure within Selling and administrative expenses. For 2017, represents the amortization of inventory "step-up" related to the acquisitions of David Michael, Fragrance Resources and PowderPure, included in cost of goods sold, and transaction costs related to the acquisitions of David Michael, Fragrance Resources and PowderPure, included in Selling and administrative expenses. | |||||||||||||||||
| (c) | For 2018, represents costs related to the integration of David Michael and Frutarom. For 2017, represents costs related to the integration of David Michael and Fragrance Resources acquisitions. | |||||||||||||||||
| (d) | Represents additional charge related to litigation settlement. | |||||||||||||||||
| (e) | Represents the reserve for payment of a tax assessment related to commercial rent for prior periods. | |||||||||||||||||
| (f) | For 2018, represents severance costs related to the 2017 Productivity Program. For 2017, represents severance costs related to the 2017 Productivity Program which were partially offset by the reversal of 2015 severance charges that were no longer needed. | |||||||||||||||||
| (g) | Represents the release of CTA related to the liquidation of a foreign entity. | |||||||||||||||||
| (h) | For 2018, represents recoveries from the supplier for the third quarter, partially offset by final payments to the customer made for the effected product in the first quarter. For 2017, represents management's best estimate of losses related to the previously disclosed FDA mandated recall. | |||||||||||||||||
| (i) | Represents charges incurred related to enactment of certain U.S. tax legislation changes in December 2017. | |||||||||||||||||
| (j) | Represents transaction-related costs and expenses related to the acquisition of Frutarom. Amount primarily includes $39.4 million of bridge loan commitment fees included in Interest expense; $34.9 million make whole payment on the Senior Notes - 2007 and $3.9 million realized loss on a fair value hedge included in Loss on extinguishment of debt; $12.5 million realized gain on a foreign currency derivative included in Other income; and $26.8 million of transaction costs included in administrative expenses. | |||||||||||||||||
| (k) | The income tax expense (benefit) on non-GAAP adjustments is computed in accordance with ASC 740 using the same methodology as the GAAP provision of income taxes. Income tax effects of non-GAAP adjustments are calculated based on the applicable statutory tax rate for each jurisdiction in which such charges were incurred, except for those items which are non-taxable for which the tax expense (benefit) was calculated at 0%. For third quarter of 2018, certain non-GAAP adjustments were subject to valuation allowances and therefore was calculated at 0%. | |||||||||||||||||
| (l) | The sum of these items does not foot due to rounding. | |||||||||||||||||
| The Company tracks the amount of amortization recorded on recent acquisitions in order to monitor its progress with respect to its Vision 2020 goals. The following amounts were recorded with respect to recent acquisitions: $2.1M related to PowderPure, $5.6M related to Fragrance Resources, $3.4M related to David Michael, $6.4M related to Lucas Meyer Cosmetics, and $4.7M related to Ottens Flavors | ||||||||||||||||||
521 West 57th
Street
T +212.765.5500
F +212.708.7132
iff.com
View source version on businesswire.com: https://www.businesswire.com/news/home/20181105005979/en/
Source:
International Flavors & Fragrances Inc.
Michael DeVeau,
212-708-7164
Head of Investor Relations and Communications &
Divisional CFO, Scent
Michael.DeVeau@iff.com